
Forecasting Flight Performance: Expectations vs. Reality
A Critical Analysis of Arbitrary Flight Performance Limits in F3B Distance Flying, Taking Meteorological Factors into Account
Fridolin Fritz, Innsbruck
This paper was distributed to the members of the CIAM RC Gliding Subcommittee, CIAM officials who served as jury members at the World Championships, the CIAM Chair, the CIAM Technical Secretary, and F3B teams interested in the topic.
Excessively large point differences in the performance records led to frustration and general dissatisfaction with the open scoring procedure. The open scoring system is considered to be lacking in objectivity because the seemingly dominant influence of weather on flight performance (“weather lottery”) leads to unfair performance evaluations that distort the true circumstances.
Logical link between weather and flight performance: The flight model, as a “performance generator” in weather-dependent airspace, yields performance metrics influenced by weather. However, the extent to which weather influences flight performance is difficult to determine directly due to numerous other dependencies (pilot, weather, infrastructure) and associated interdependencies. Careful and comprehensive observation of competitive dynamics provides the key to quantitative conclusions.
Successful observation, however, is only possible through observation methods tailored to the problem at hand. These methods are derived from the natural patterns of organization inherent in the structures that emerge during the competitive (and weather-related) process.
Weather phenomena, as processes of atmospheric energy exchange, are determined by a highly complex and practically unmanageable interactive system of influencing factors.
Turbulence is the phenomenon through which the atmosphere closes its energy cycle.
Due to the countless influencing factors, turbulence systems—and thus weather processes as well—cannot be modeled in a deterministic sense.
Processes of this kind are so-called stochastic (random) processes, which can be described exclusively through the use of statistics and probability theory.
Weather has a statistical structure.
Because flight performance depends, at least in part, on the weather, every performance record has a statistical structure. The random nature of weather phenomena means that each individual performance must be regarded as a realization of a random variable, whereby each individual realization value varies from the true (weather-uninfluenced) performance value to the extent that the weather determining the performance is characterized by more or less structured turbulence systems.
Statements about random variables become more reliable as the number of underlying individual observations increases (law of large numbers).
The magnitude of the weather’s influence ultimately depends on two factors: 1. the structure and energy content of the turbulence, and 2. the number of runs (individual performance results) in the competition.
Statistical balancing is only possible if 1. there are at least two individual performance results, which 2. must be statistically valid (flown without performance limitations!).
Since F3B competitions usually have more than two runs, a considerable degree of statistical balancing is already possible (see diagram).
Conclusion: While the influence of the weather is significant when only a single round is flown, it diminishes considerably as the number of evaluable rounds increases.
Since every pilot has the opportunity to complete the same number of scoring flights (rounds), they all fall within the range of variation of the prevailing weather conditions. Extreme differences in scores due to weather are therefore only possible to the extent of the weather variation (which is approximately the same for everyone).
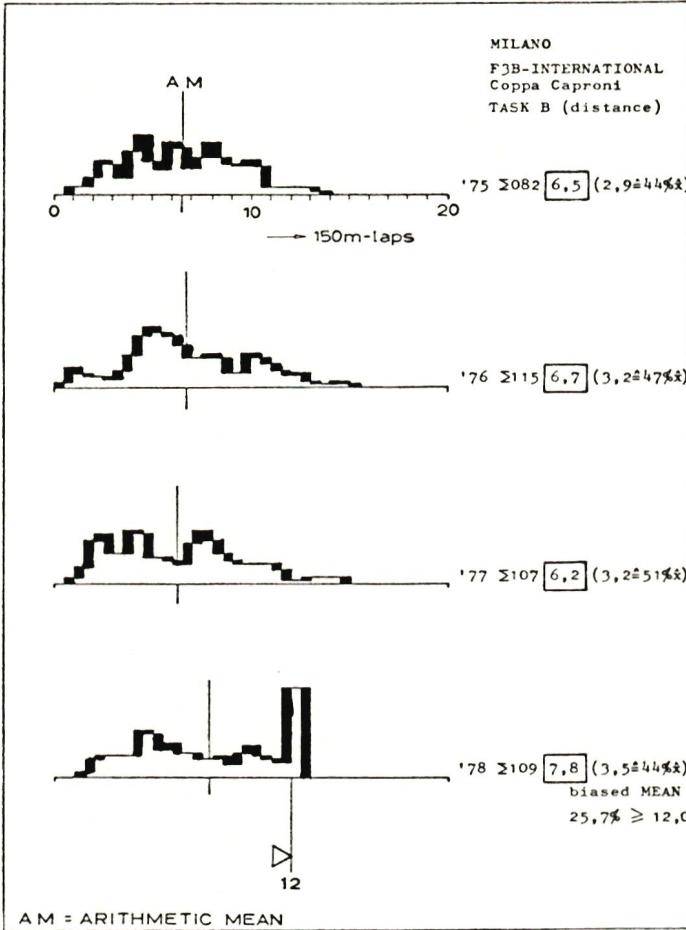
Any flight that exceeds the 12-lap performance limit is lost in the statistically correct processing.
If such “truncated” flights are nevertheless included in the performance calculation (formation of the value judgment), they distort the performance statement (distortion reinforces the subjectivity of the performance judgment).
Value judgments are all the more distorted the better 1. the average flying weather is and the higher 2. the performance capability of the pilot, his model, and his infrastructure is.
These circumstances lead to the current situation, in which more than 40–80%, and in some extreme cases even 100%, of all competitors fly more than 12 laps. Consequence: Dissatisfaction; frustration over the lack of selection options; competition becomes meaningless and is reduced to absurdity.
Consequences: The “good” (high-performing) pilot is penalized; the better they are, the more they are penalized (progressive penalties, ranking dispersion). A dual standard emerges: The “bad” competitors, who are granted the right to full (unrestricted) performance; the “good” competitors, who are deprived of this right (they must, after all, settle for distorted performance results!). The universally valid principle of “equal rights for all” is violated! The influence of weather is significantly increased (the opposite of what was intended by introducing the performance limit!) due to the reduction in the number of flights that (as “unrestricted” flights) can correctly be included in the scoring process.
Any form of performance limitation that is arbitrary and statistically unjustified must be rejected.
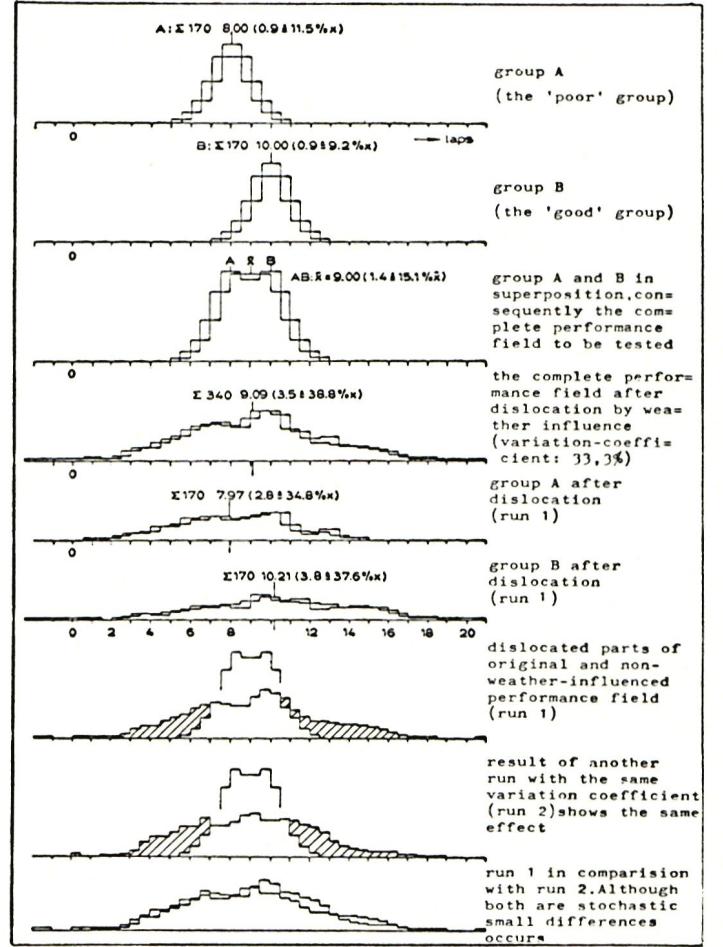
A: $\Sigma 170$ 8,00 (0,9 $\hat{=} 11,5 \% \bar{x}$ )
group A (the 'poor' group)
B: $\Sigma 170$ 10,00 (0,9 $\hat{=} 9,2 \% \bar{x}$ )
group B (the 'good' group)
AB: $\bar{x} = 9,00$ (1,4 $\hat{=} 15,1 \% \bar{x}$ )
group A and B in superposition, consequently the complete performance field to be tested
$\Sigma 340$ 9,09 (3,5 $\hat{=} 38,8 \% \bar{x}$ )
the complete performance field after dislocation by weather influence
(variation-coefficient: 33,3%)
$\Sigma 170$ 7,97 (2,8 $\hat{=} 34,8 \% \bar{x}$ )
group A after dislocation
(run 1)
$\Sigma 170$ 10,21 (3,8 $\hat{=} 37,6 \% \bar{x}$ )
group B after dislocation
(run 1)
dislocated parts of original and non-weather-influenced performance field
(run 1)
result of another run with the same variation coefficient (run 2) shows the same effect
run 1 in comparision with run 2. Although both are stochastic small differences occurs
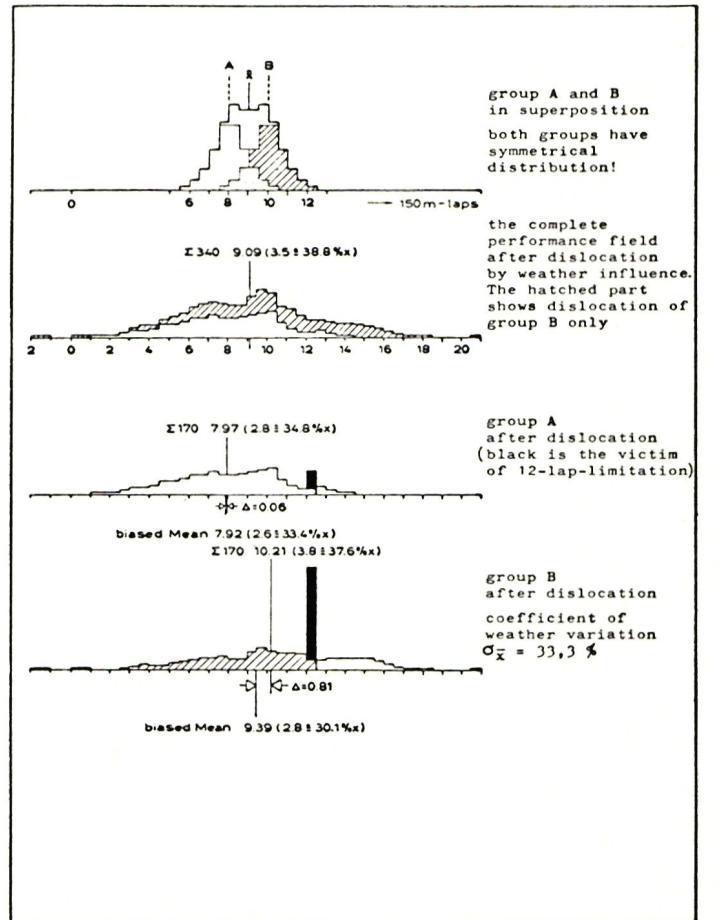
group A and B in superposition
both groups have symmetrical distribution!
$\Sigma 340$ 9,09 (3,5 $\hat{=} 38,8 \% \bar{x}$ )
the complete performance field after dislocation by weather influence. The hatched part shows dislocation of group B only
$\Sigma 170$ 7,97 (2,8 $\hat{=} 34,8 \% \bar{x}$ )
group A after dislocation
(black is the victim of 12-lap-limitation)
biased Mean 7,92 (2,6 $\hat{=} 33,4 \% \bar{x}$ )
$\Sigma 170$ 10,21 (3,8 $\hat{=} 37,6 \% \bar{x}$ )
group B after dislocation
coefficient of weather variation $
\bar{\sigma}_x = 33,3 \%$
biased Mean 9,39 (2,8 $\hat{=} 30,1 \% \bar{x}$ )


News from HEBU
TEAM MANAGER "THIS" BOSSHARD
 Rodito Nussbaumer
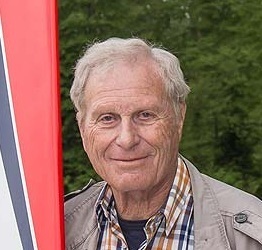
YOU KNOW WHAT I MEAN? 125 YEARS OF THE SWISS AERO CLUB
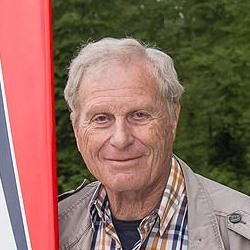 Emil Giezendanner

PRIDE AND GOOD IDEAS
 Markus Nussbaumer
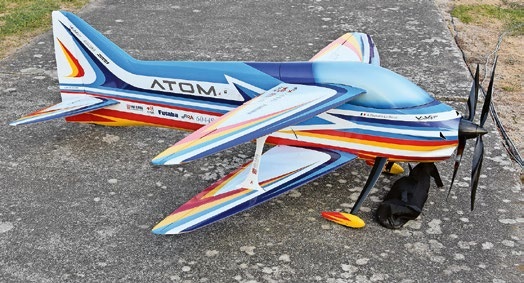
ATOM, THE NEW DOUBLE-DECKER FROM CPLR
 Matthias Bosshard
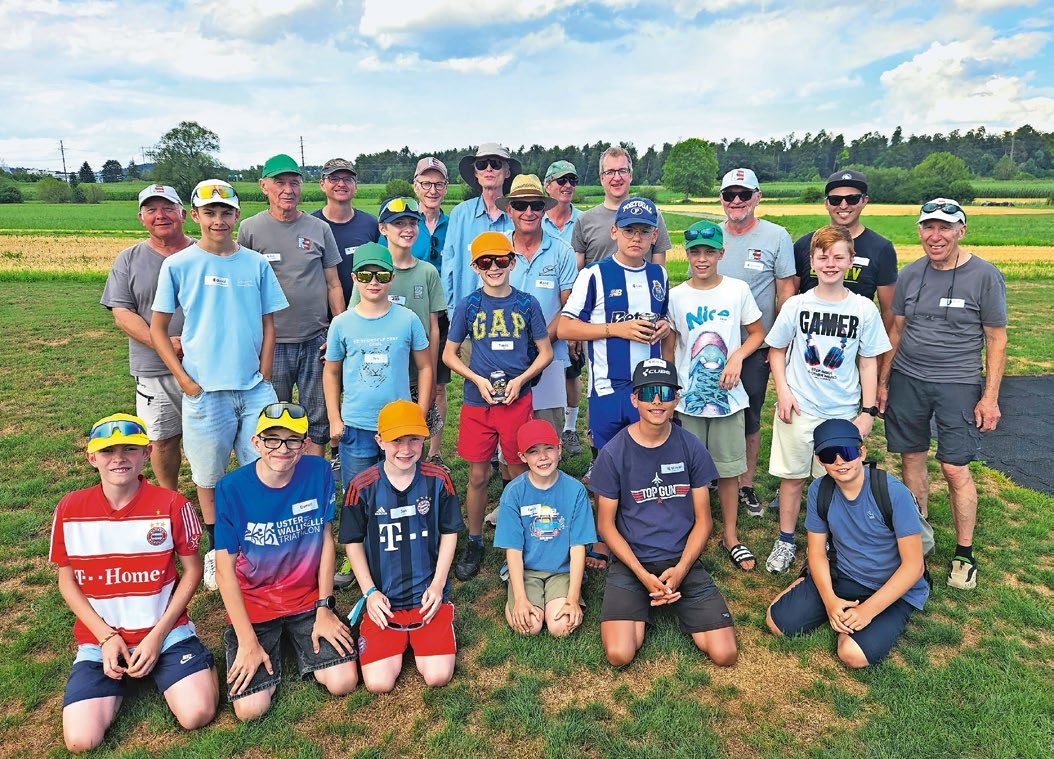
SUMMER FUN 2026 AT MG USTER
Martin Wunderli
F3A EUROPEAN CHAMPIONSHIPS IN ST-MACAIRE, FRANCE
Matthias Bosshard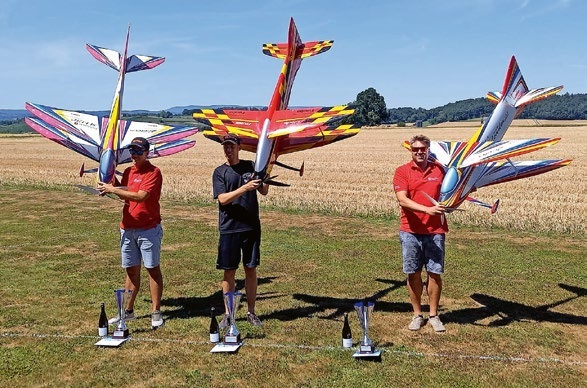
52. 2026 ALPS CUP
Emil Giezendanner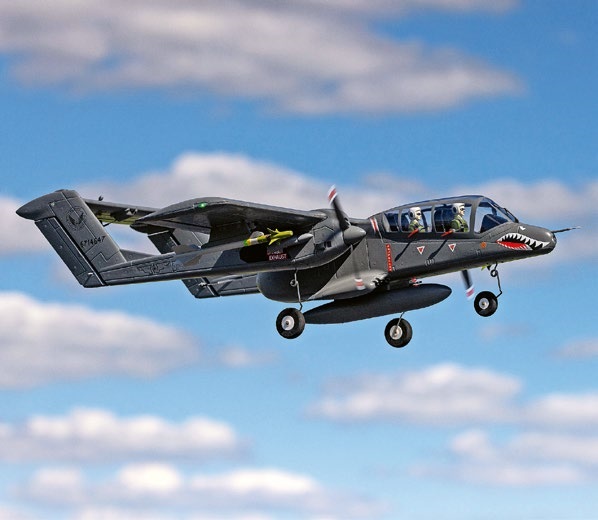
HORIZON HOBBY/LEMACO NEWS: MICRO OV-10 BRONCO 645 MM BY E-FLITE
TWIN TOWN PARTNERSHIP
Wolfgang Voeller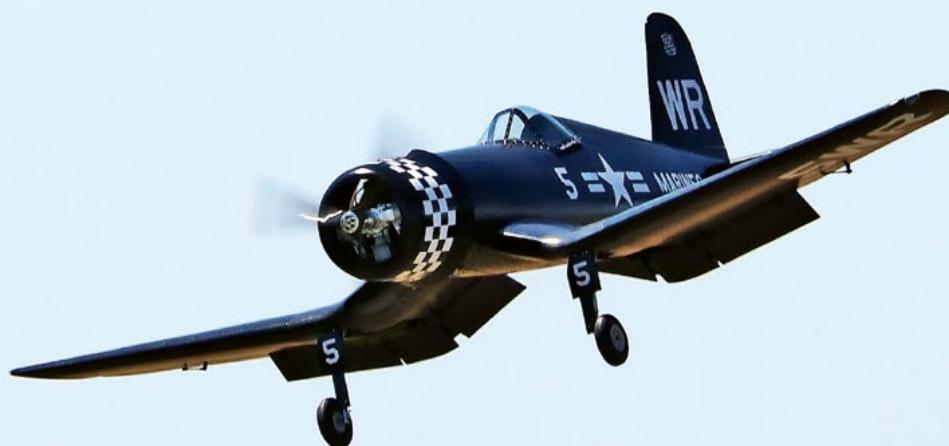
CORSAIR F4U – A WARBIRD WITH A MEMORABLE LOOK
Jürgen Rosenberger, Jürgen Prinz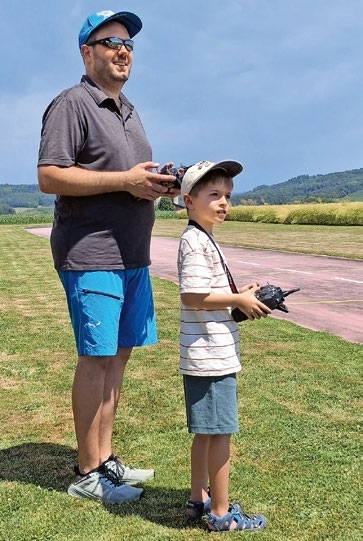
TRY-OUT DAY AT MFV WETTINGEN
Urs Keller
EURO CONTEST GLIDER ACRO TOUR AUSTRIA 2026
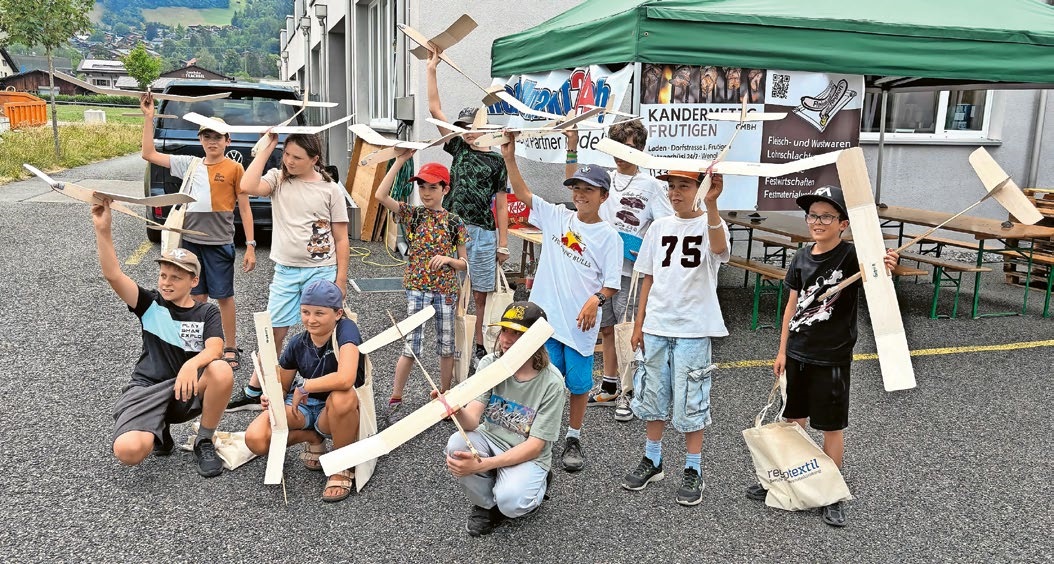
BY YOUTH, FOR YOUTH
Lorena Betschen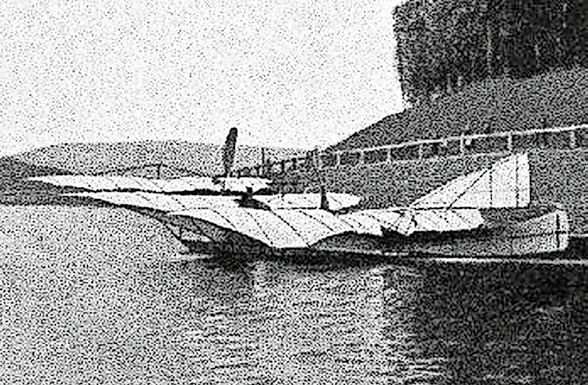
INSIGHTS INTO THE HISTORY OF SEAPLANES
SMALL, MODEL-LIKE SAILBOATS
Res Dauwalder
What's New at Leomotion.com
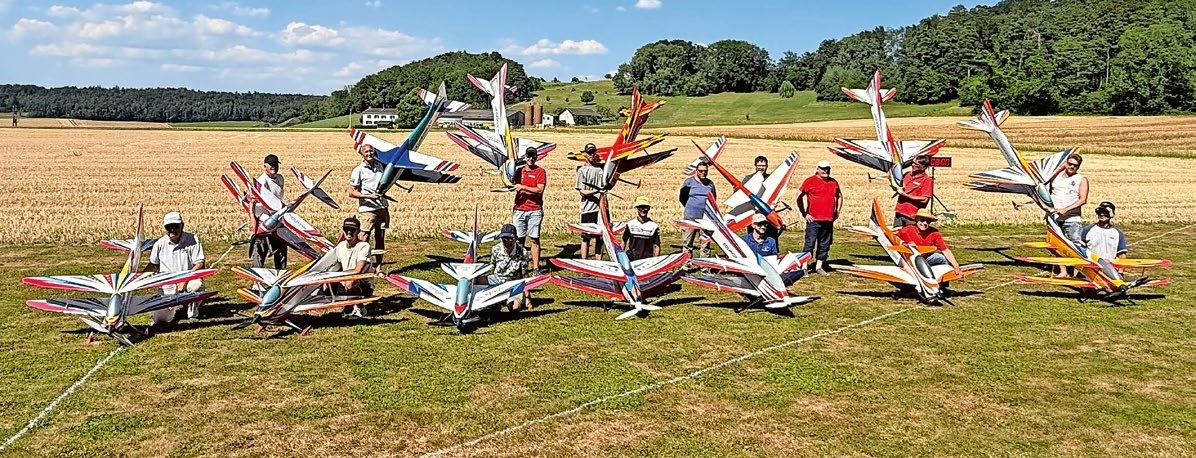
COUPE DES ALPES – OBSERVE AND LEARN
Rodito Nussbaumer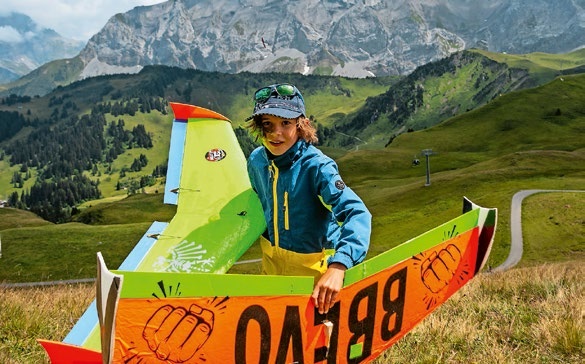
34th HAHNENMOOS ALPINE MODEL AIRPLANE CAMP
Res Dauwalder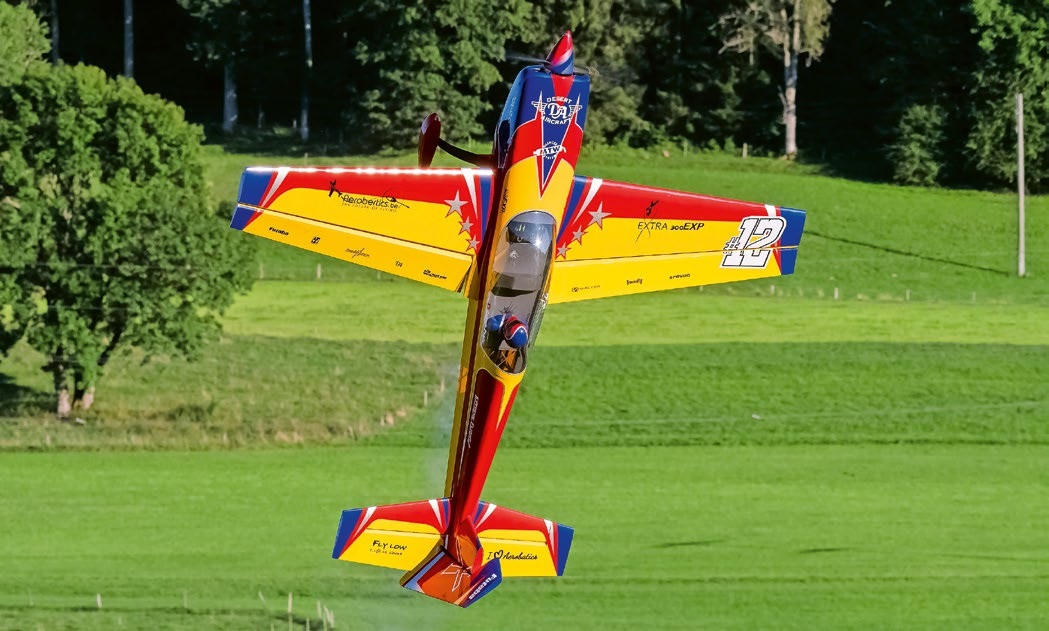
WELCOME, NEW MEMBER!
Andrea Bolliger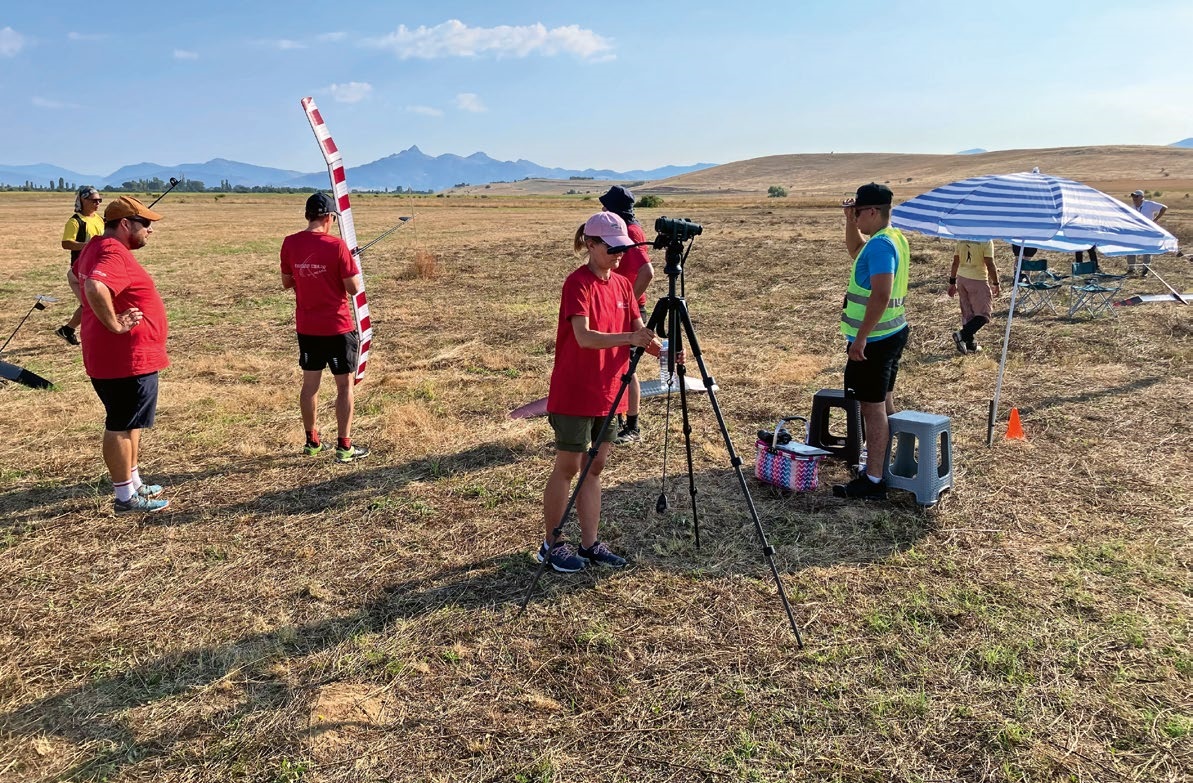
FREE FLIGHT IN THE MIDDLE OF SUMMER
Urs Muntwyler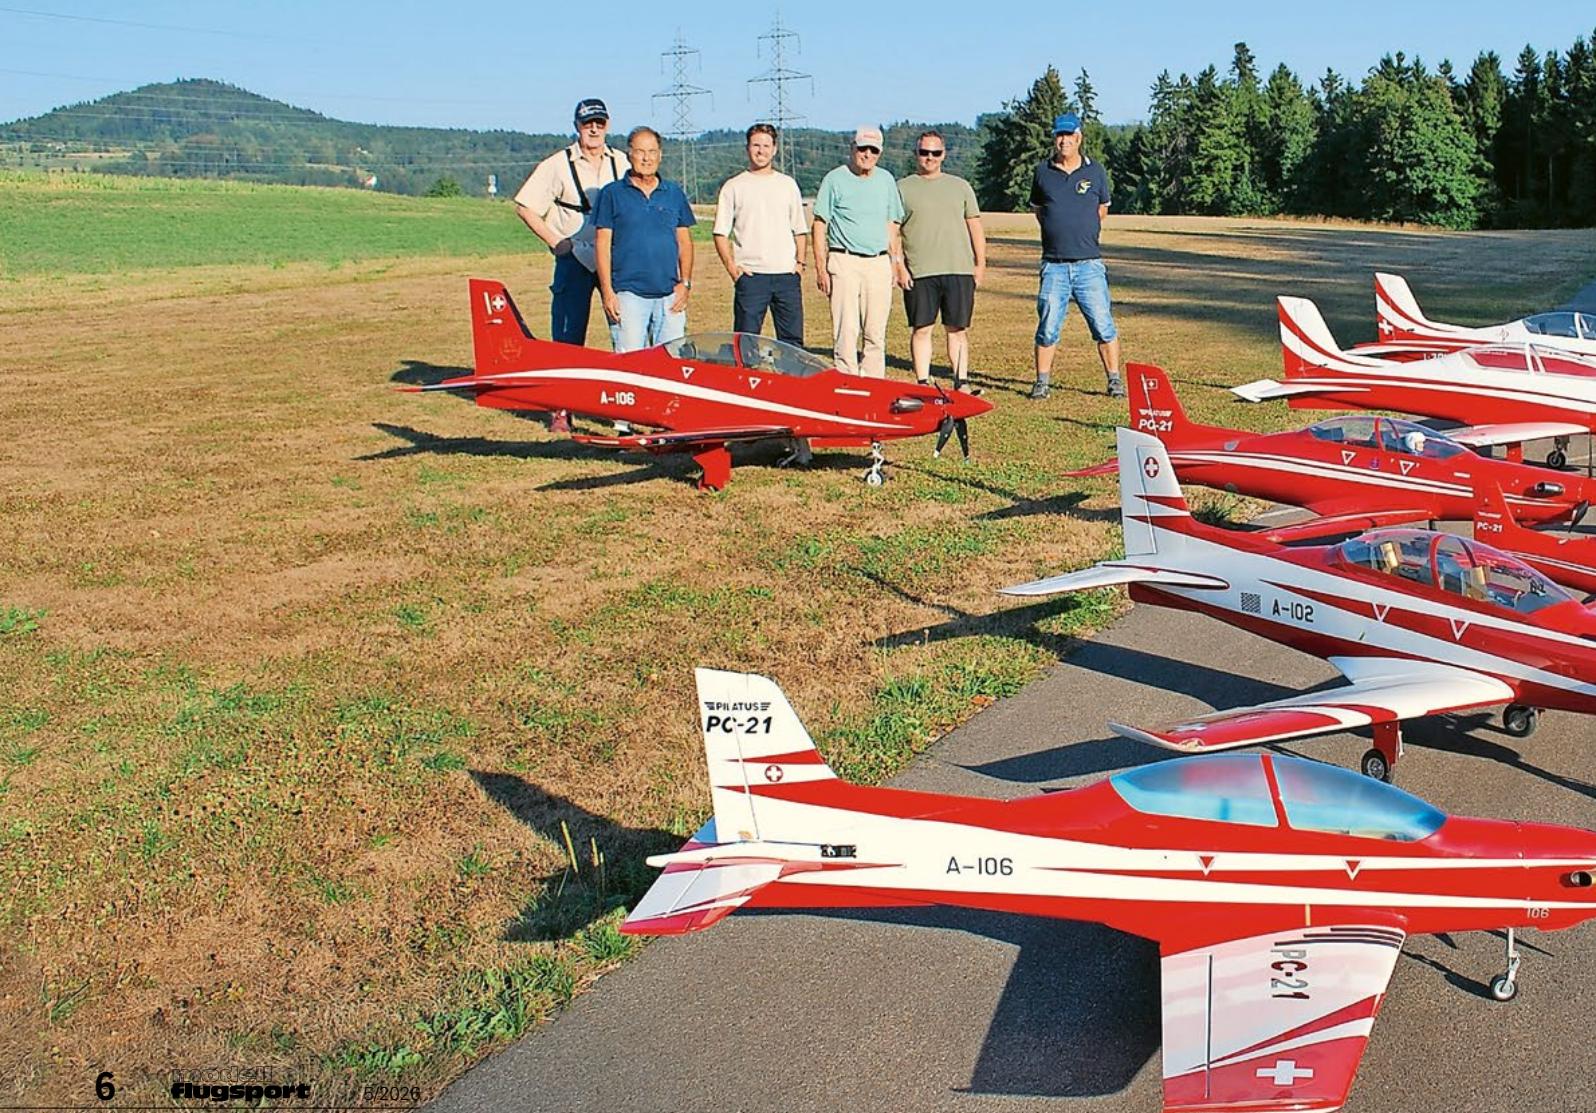
THE PC-21 STORY
Emil Giezendanner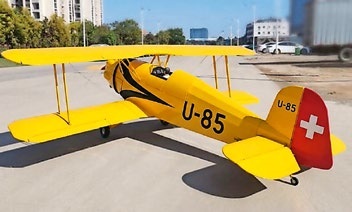
NEWS FROM HEBU
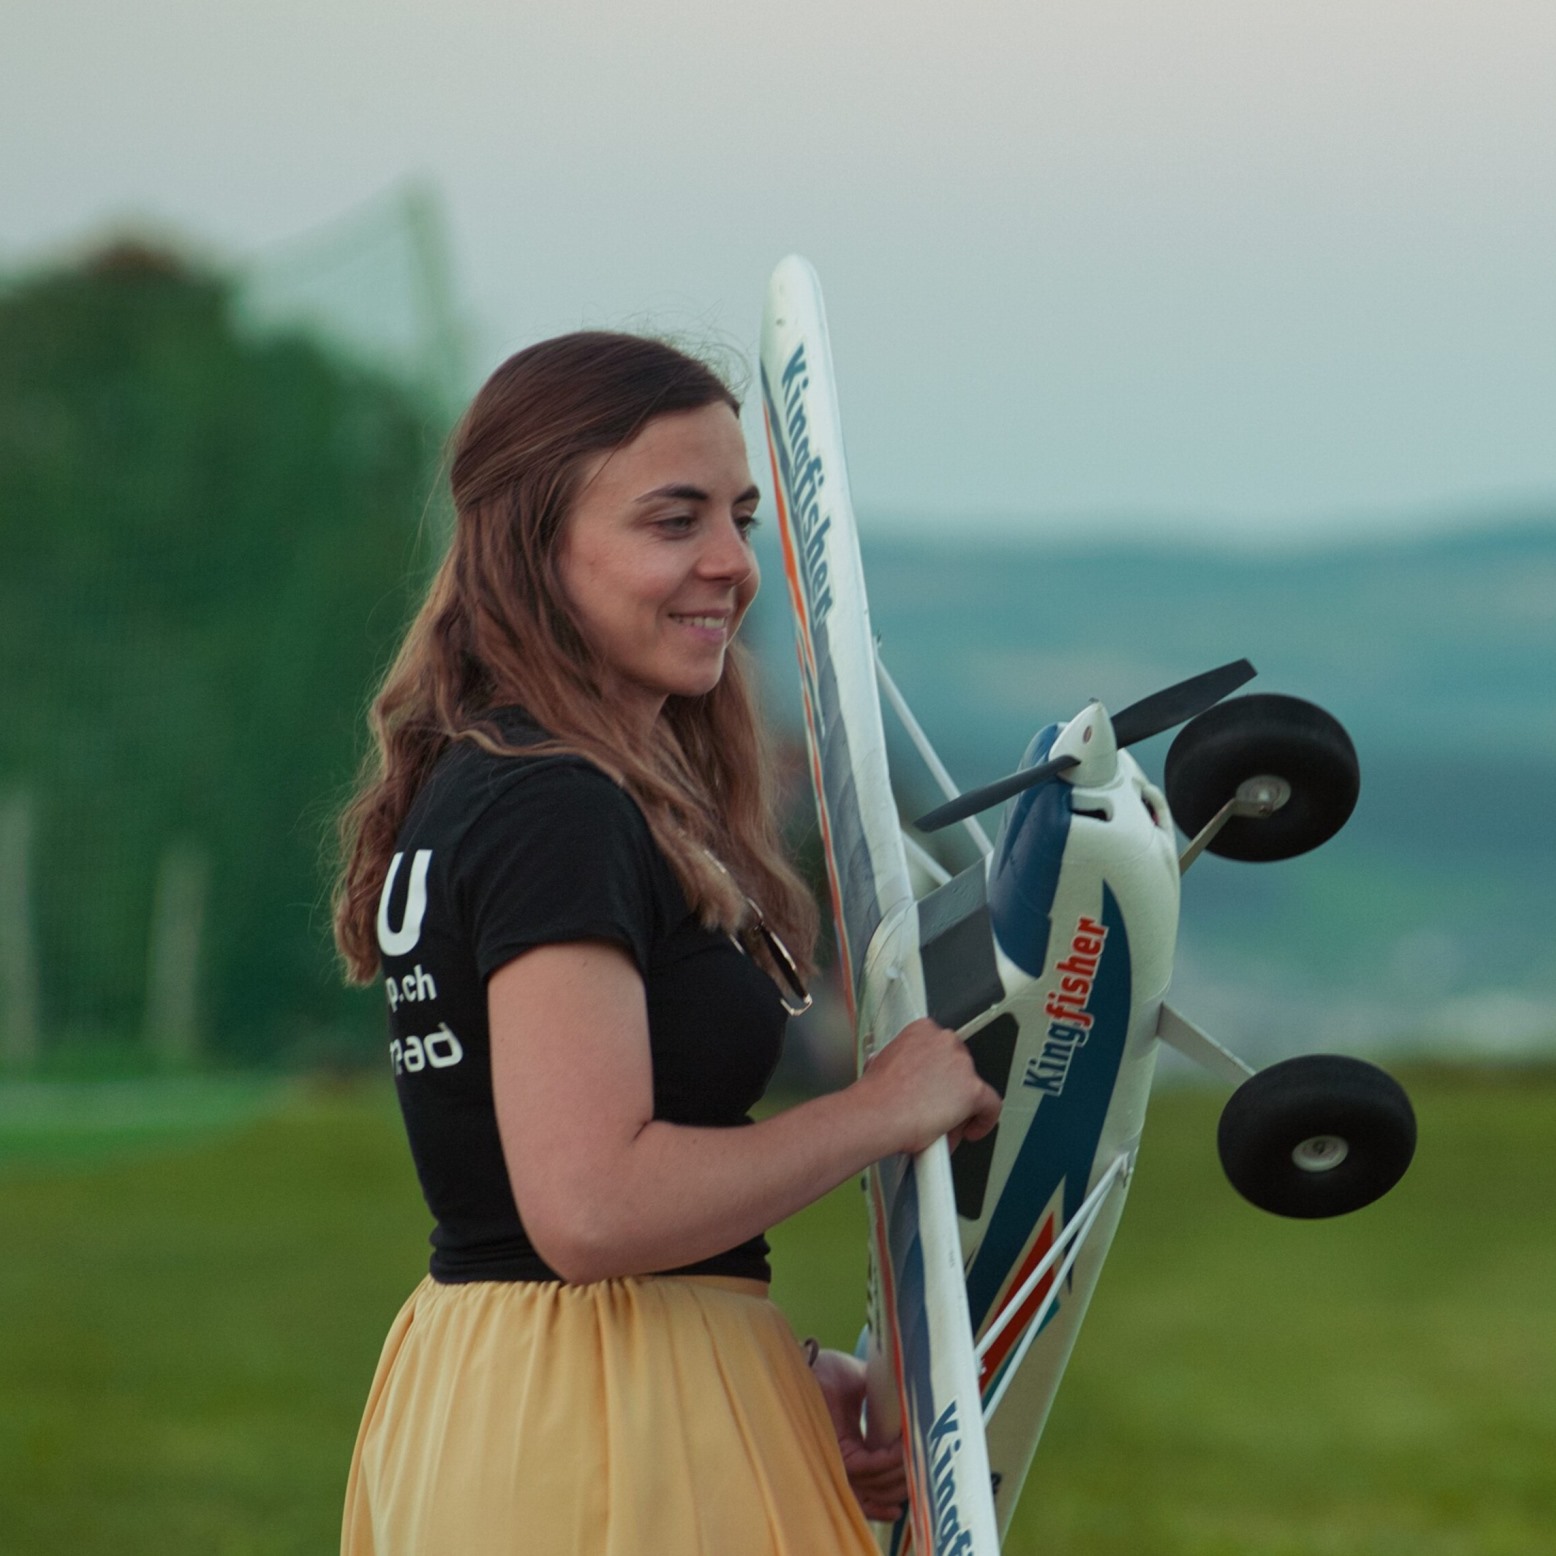 Julia Bucher
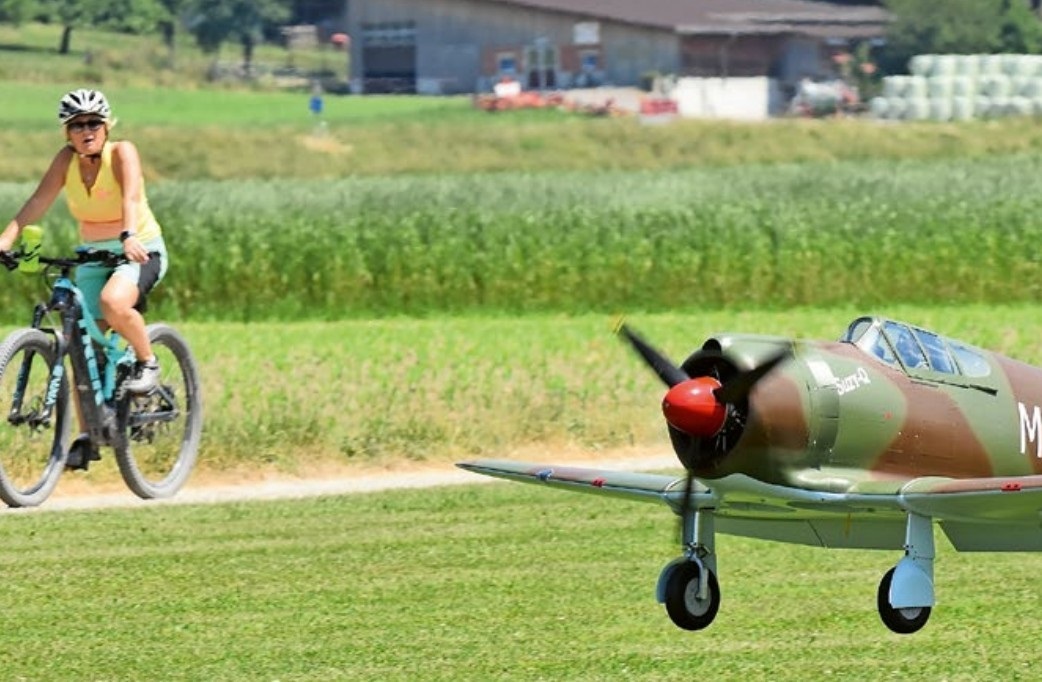
FROM 0 TO 100
Markus Nussbaumer
MEMORIES
Wolfgang Völler
NOS REGION – A HUB FOR ELECTRIC AVIATION
Emil Giezendanner
Have you almost forgotten about aircraft that take off and land vertically?
Emil Giezendanner
DO YOU KNOW WHAT I MEAN IN THE LAND OF SMILES?
Emil Giezendanner